Cumulative exposure assessment
exposure.RdAssessment of the exposure (i.e. overlap) between valued components and environmental drivers in the context of cumulative effects assessments
Usage
exposure(drivers, vc, exportAs = c("list", "stars"))Arguments
- drivers
distribution and intensity of environmental drivers as stars object
- vc
distribution of valued components as stars object
- exportAs
string, the type of object that should be created, either a "list" or a "stars" object
Examples
# Data
drivers <- rcea:::drivers
vc <- rcea:::vc

# Exposure
(expo <- exposure(drivers, vc, "stars"))
#> stars object with 3 dimensions and 20 attributes
#> attribute(s):
#>            Min.   1st Qu.    Median      Mean   3rd Qu. Max.  NA's
#> vc1   0.2021352 0.5213672 0.6129986 0.6136429 0.6940780    1 19256
#> vc2   0.2616746 0.5185849 0.6117746 0.6113144 0.6938048    1 19357
#> vc3   0.2375020 0.5226039 0.6082802 0.6068182 0.6858955    1 18655
#> vc4   0.1941005 0.5288972 0.6139892 0.6120621 0.6893543    1 18527
#> vc5   0.2452544 0.5281468 0.6097971 0.6143875 0.6969998    1 18953
#> vc6   0.2759878 0.5257590 0.6054765 0.6076875 0.6823719    1 18680
#> vc7   0.2009212 0.5297309 0.6149135 0.6118864 0.6935994    1 18948
#> vc8   0.1941005 0.5242333 0.6048160 0.6104447 0.6839465    1 19468
#> vc9   0.1638378 0.5231641 0.6097690 0.6108584 0.6938352    1 18613
#> vc10  0.1941005 0.5304054 0.6133002 0.6136116 0.6962600    1 18404
#> vc11  0.1638378 0.5282763 0.6140082 0.6122241 0.6929783    1 17697
#> vc12  0.2445233 0.5222109 0.6105871 0.6082432 0.6923947    1 18929
#> vc13  0.1941005 0.5225111 0.6105436 0.6091227 0.6927667    1 18840
#> vc14  0.2009212 0.5283231 0.6117160 0.6095563 0.6944252    1 18938
#> vc15  0.1941005 0.5204771 0.6076877 0.6033786 0.6835737    1 19300
#> vc16  0.1941005 0.5294499 0.6185720 0.6143025 0.6923047    1 18759
#> vc17  0.2021352 0.5241139 0.6077421 0.6083483 0.6912994    1 18601
#> vc18  0.1638378 0.5280775 0.6140542 0.6131161 0.6939189    1 18169
#> vc19  0.2061731 0.5285207 0.6117942 0.6121077 0.6909626    1 17974
#> vc20  0.1941005 0.5237485 0.6129409 0.6121863 0.6953557    1 18437
#> dimension(s):
#>         from to offset delta              values x/y
#> x          1 45   -100     5                NULL [x]
#> y          1 45    125    -5                NULL [y]
#> drivers    1 10     NA    NA driver1,...,driver9
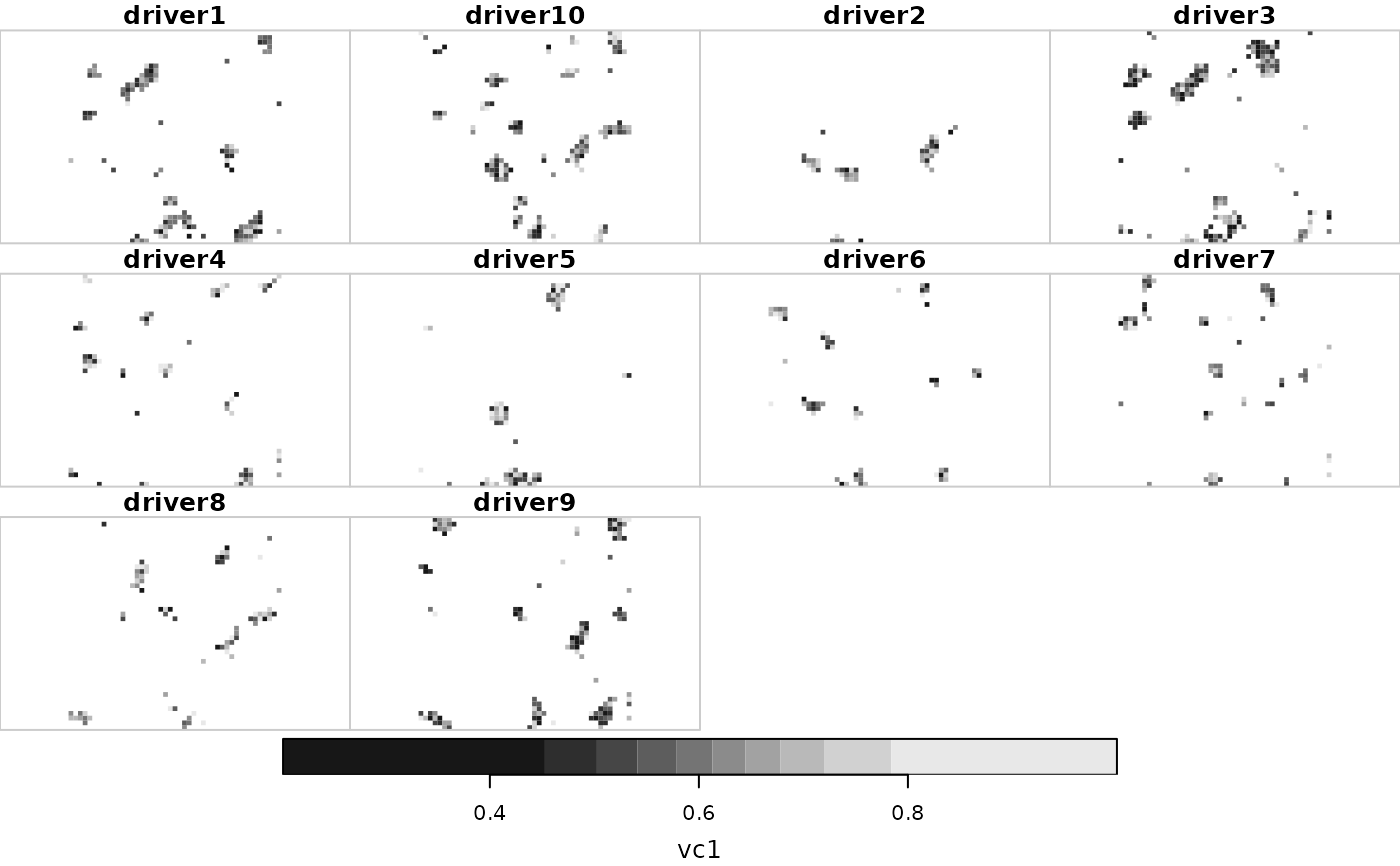
plot(expo)

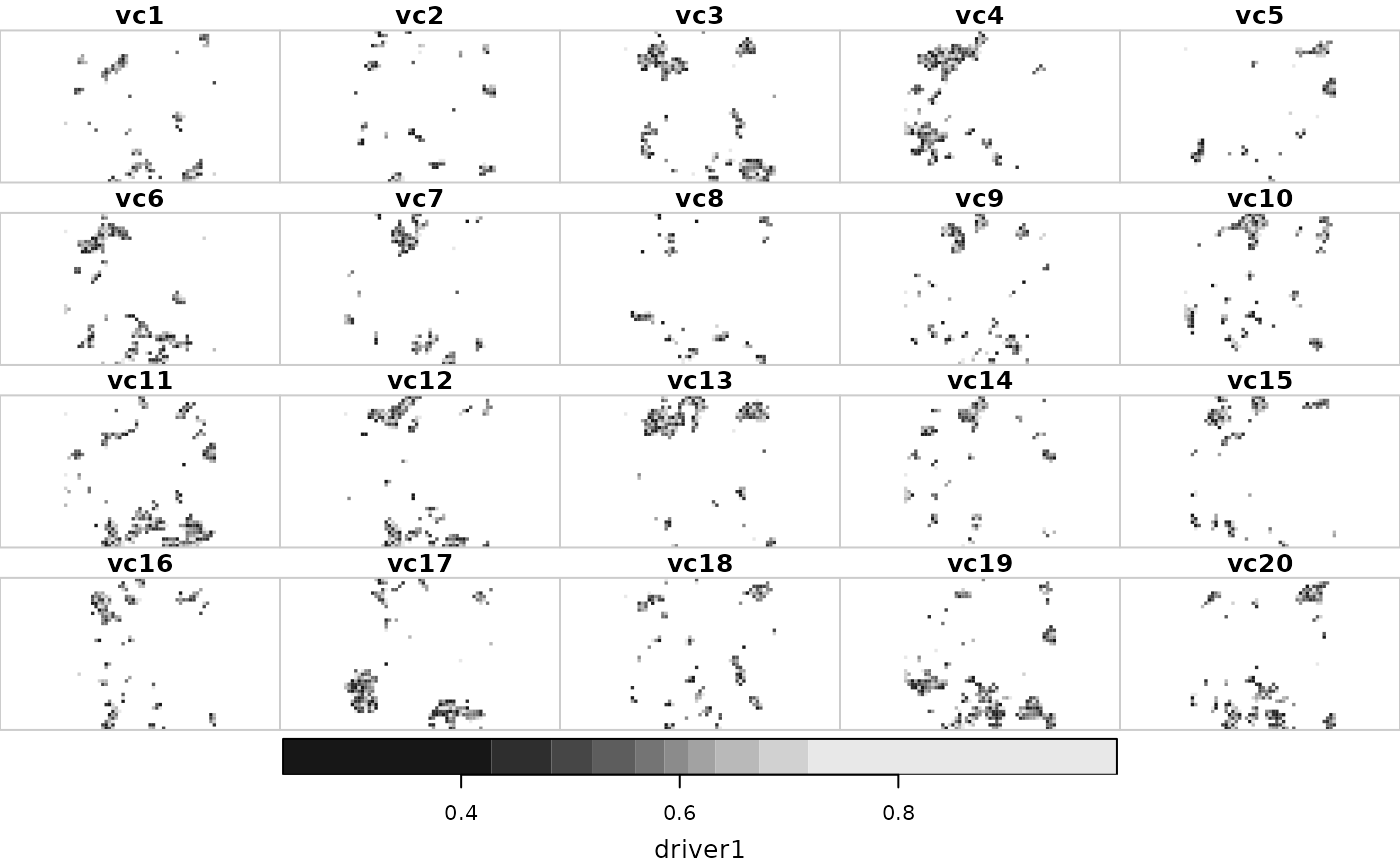
expo <- merge(expo, name = "vc") |>
  split("drivers")
plot(expo)
